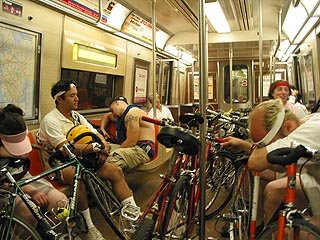
NYC Subway Morning Demographics

A NYC blogger spent the morning noting the who rides and at what time. Take a look at the observations below. Pretty cool stuff!
Because I often work very late or come in very early to the office, I have
been able to observe some demographic patterns on the subways in the AM hours.
It’s interesting to see how the ethnic, class, professional, and gender makeup
evolves as the morning hours go by.(Please forgive the generalizations inherent in ad hoc ethnography):
3:00-4:00 AM Drunks of all sorts, club kids, and winos. Late
night workers, busboys, getting off their shifts. Only a handful of people per
car. 6:1 male/female ratio.4:00-5:00 AM Transit workers changing shifts. Maybe 6 people
per car. All male.5:00 AM - 6:00 AM Blue-collar laborers, minorities,
immigrants. Half the car is asleep. Maybe 20 or 25 people per car. 9:1
male/female ratio.6:00 AM - 7:00 AM Construction workers, blue-collar
laborers, hospital workers. 75% of seats in car are taken. 7:3 male/female
ratio.7:00 AM - 8:00 AM Low-level office workers, civil service
workers, some Wall Street broker types. Mostly minorities, lots of black women,
lots of all kinds of women in fact. 90% seats occupied. 1:2 male/female ratio.8:00 AM - 9:00 AM Professionals, white collar workers,
office workers. 100% seats occupied, many people standing. 1:1 male/female
ratio.9:00 AM - 10:00 AM Early-career yuppies running a little
late, creative industry workers, all sorts of professionals. 100% occupied. 1:1
male/female ratio.10:00 AM - 11:00 AM Hung over office workers, some seats
available. 2:1 male/female ratio.11:00 AM - noon Starting to see people who are running
errands for work, not just going to or coming from work. Plenty of open seats.
3:2 male/female ratio.UPDATE: Great stuff from a 2004 New York Times special
section dedicated to the NYC Subways (thanks Gothamist):A diagram of the hourly population density of the subway (the 1/9 line) over
the course of a single work day.A drawing of the demographics and cultures along the F line (my line!)
station-by-station, by the excellent Danny Gregory.
(Via Boing Boing)

1 Comments:
Another interesting way to use demographic data…
Looking to buy a house in LA, Seattle or Phoenix, in a good neighborhood with plenty of disposable income? Plot all the Starbucks in town on maps.google.com. Purchase a home in or near the highest concentration Starbucks cluster area (this method lets Starbucks do your demographic studies for you)… you may prefer the suburban cluster over the downtown cluster …
by brian
Post a Comment
<< Home