The Markr as a graph
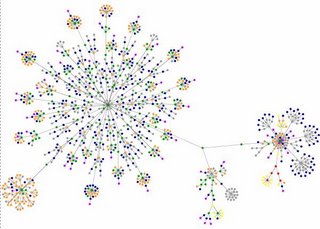
This cool java app has been circulating around the 'net this week, so I thought I'd create a map of The Markr. It's a cool way to graphically see what makes up and links to your website. App created by Sala (check out his blog).
Here's an explanation of the colored tags:
blue: for links (the A tag)
red: for tables (TABLE, TR and TD tags)
green: for the DIV tag
violet: for images (the IMG tag)
yellow: for forms (FORM, INPUT, TEXTAREA, SELECT and OPTION tags)
orange: for line breaks and block quotes (BR, P, and BLOCKQUOTE tags)
black: the HTML tag, the root node
gray: all other tags
